I have been playing with the COVID-19 data since it has been released by Johns Hopkins on GitHub. This data is updated every day from various data sources such as WHO, CDC and health organizations of other countries.
This blog talks about how to implement Timeseries Forecasting using Prophet for predicting the number of cases by country. Since I live in the US, I have taken US data to show the plots, but this can be used for global data or any country.
Step 1: Setup
- Data: Data Repository by Johns Hopkins CSSE
- Language: Python
- Package: Prophet
- Compute: Google Colab
Step 2: Read the Data
The data is provided by Johns Hopkins on Git. I used Python’s pandas CSV reader to read the data.
import pandas as pd
import csv
import numpy as np
from datetime import datetime, timedelta
import matplotlib.pyplot as plt
from fbprophet import Prophet

baseurl = 'https://raw.githubusercontent.com/CSSEGISandData/COVID-19/master/'
Confirmed_url = 'csse_covid_19_data/csse_covid_19_time_series/time_series_covid19_confirmed_global.csv'
Confirmed = pd.read_csv(baseurl + Confirmed_url, sep=",")
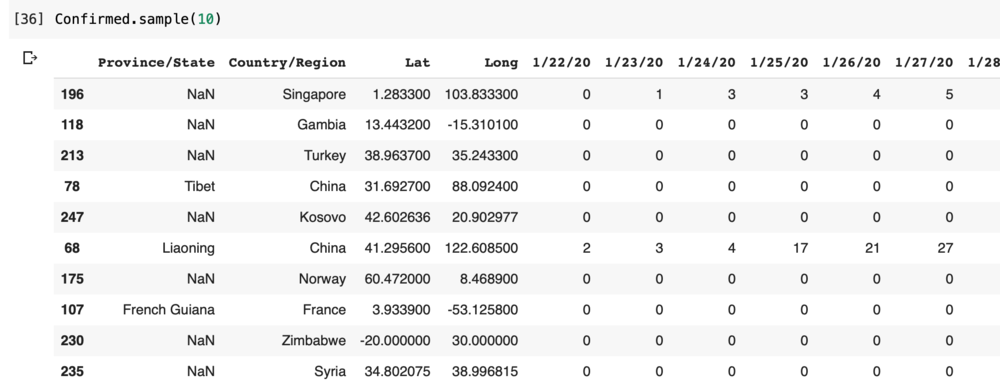
Step 3: Preparing the Data
Some countries have data by State and some have null values. The first step was to fill missing State values to keep the data cleaner.
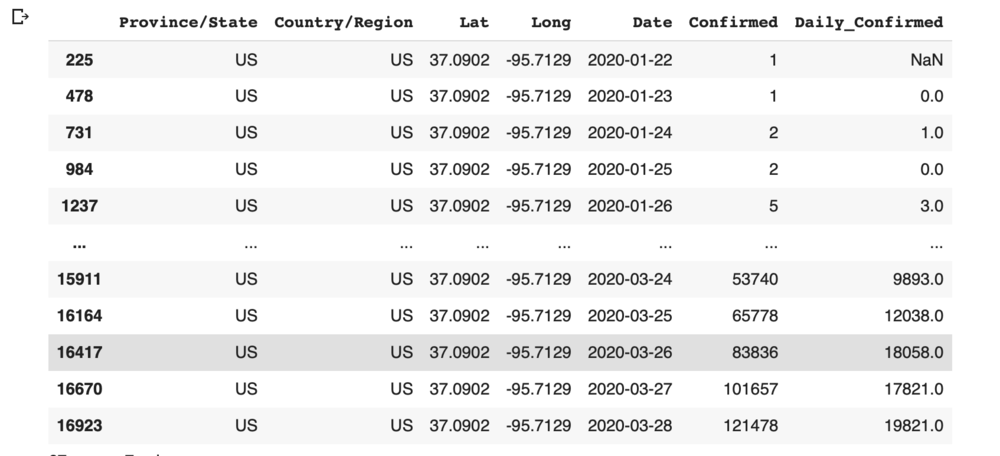
The data is a time series where each date is a column. I transposed this to have a single date column, then calculated daily new cases using the difference between current and previous dates.
Confirmed['Province/State'] = np.where(
    Confirmed['Province/State'].isnull(),
    Confirmed['Country/Region'],
    Confirmed['Province/State']
)

Confirmed = Confirmed.melt(
    id_vars=["Province/State", "Country/Region", "Lat", "Long"],
    var_name="Date",
    value_name="Confirmed"
)

Confirmed['Date'] = pd.to_datetime(Confirmed['Date']).dt.date
Confirmed = Confirmed.sort_values(by='Date', ascending=True)
Confirmed['Daily_Confirmed'] = Confirmed.groupby(
    ['Province/State','Country/Region','Lat','Long']
)['Confirmed'].diff()

subset = Confirmed[Confirmed['Country/Region'] == 'US'][:67]
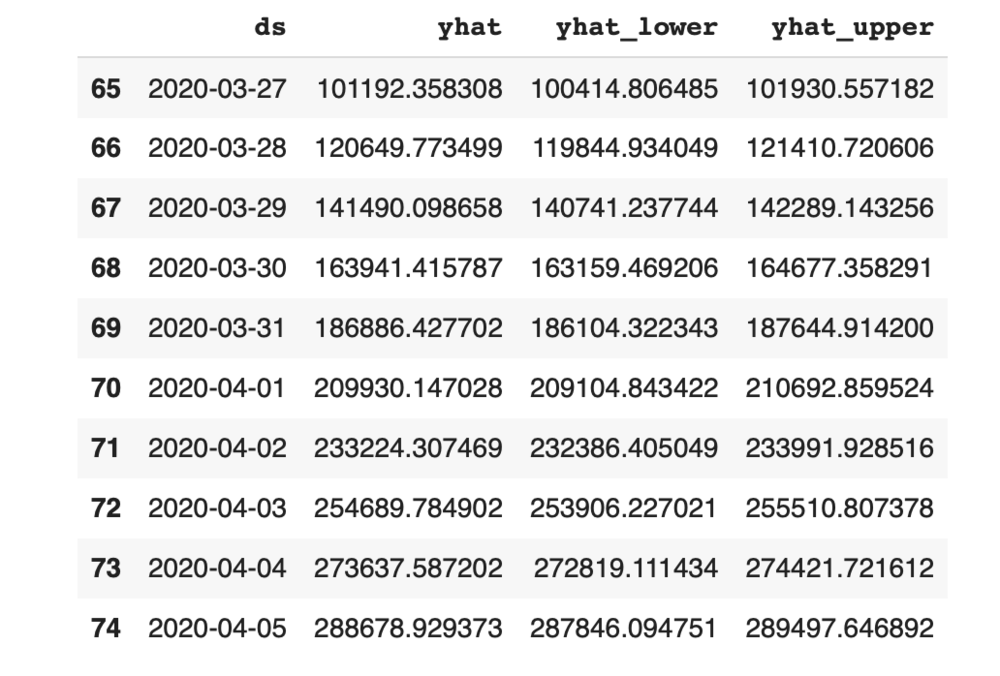
Step 4: Forecasting
I had data through March 28 and forecasted for the next 7 days. Data is prepared for Prophet using the required column format, then the forecast is generated.
subset = Confirmed
subset = subset[subset['Country/Region'] == 'US']
subset = subset.rename(columns={'Date': 'ds', 'Confirmed': 'y'})

m = Prophet(interval_width=0.95)
m.yearly_seasonality = True
m.fit(subset)
future = m.make_future_dataframe(periods=7)
future.tail()

forecast = m.predict(future)
For more on Prophet, visit the official documentation.
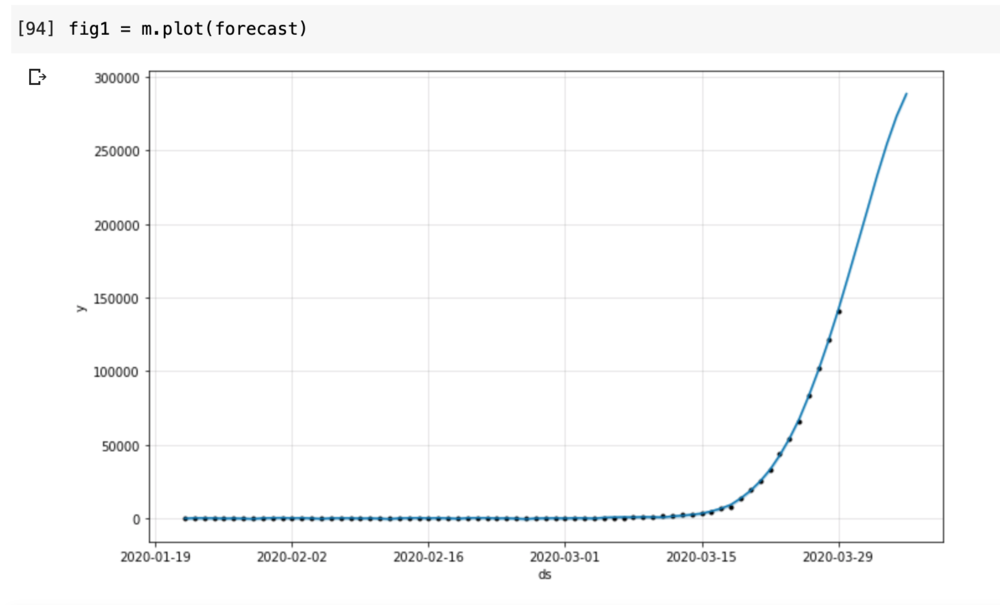
Step 5: Visualization
The results are plotted on a graph — dots represent actual data points and the blue line is the forecast. As per the forecast, the number of cases for March 29 was approximately 141,500.