The first part of this post can be found at Processing Real-Time Streams in Databricks – Part 1.
This is the continuation of Part 1 — we won’t repeat the architecture and setup. In this section we go into Azure Databricks and create the cluster and notebook to ingest data in real-time, process, and visualize the stream.
Section 4: Databricks Setup
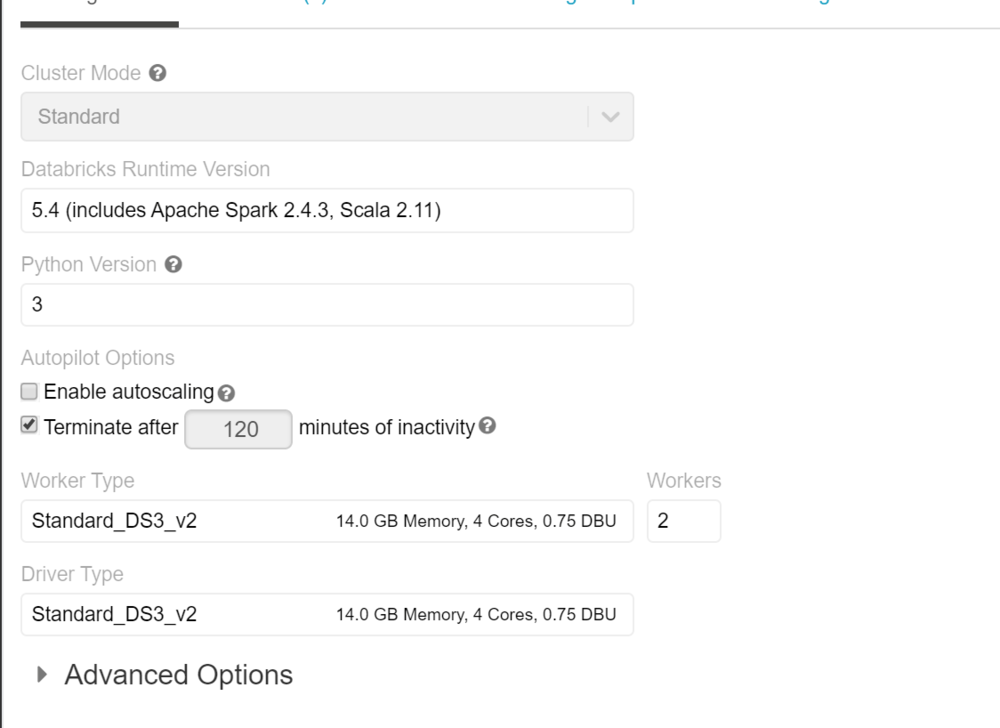
If this is your first time in the Databricks workspace, set up a cluster to provide the required compute resources. We used a simple 2-node cluster for the POC — no specific library installation needed.
Connect to the Stream Using a Notebook
Create a notebook to connect to the stream and read the real-time data. Below are the commands for a Scala notebook.
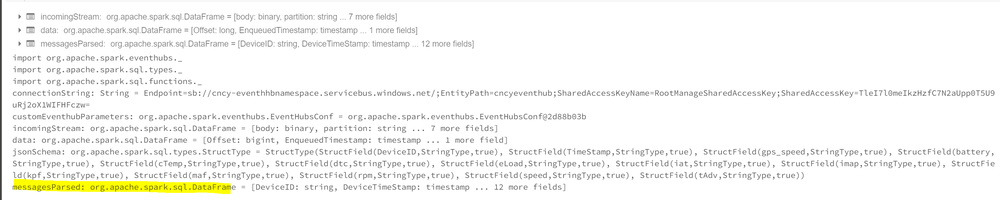
Imports needed to connect to Event Hub and run SQL functions:
import org.apache.spark.eventhubs._
import org.apache.spark.sql.types._
import org.apache.spark.sql.functions._
Connect to Event Hub and read the stream:
val connectionString = ConnectionStringBuilder("Endpoint=sb://cncy-eventhhbnamespace.servicebus.windows.net/;SharedAccessKeyName=RootManageSharedAccessKey;SharedAccessKey=...")
  .setEventHubName("cncyeventhub").build

val customEventhubParameters =
  EventHubsConf(connectionString)
  .setMaxEventsPerTrigger(100)

val incomingStream = spark.readStream
  .format("eventhubs")
  .options(customEventhubParameters.toMap)
  .load()
Define the data structure and read the stream:
val data = incomingStream
  .withColumn("Offset", $"offset".cast(LongType))
  .withColumn("EnqueuedTimestamp", $"enqueuedTime".cast(TimestampType))
  .withColumn("Body", $"body".cast(StringType))
  .select("Offset", "EnqueuedTimestamp", "Body")

data.createOrReplaceTempView("data")
Parse the JSON body with the telematics schema:
val jsonSchema = new StructType()
  .add("DeviceID", StringType)
  .add("TimeStamp", StringType)
  .add("gps_speed", StringType)
  .add("battery", StringType)
  .add("cTemp", StringType)
  .add("dtc", StringType)
  .add("eLoad", StringType)
  .add("rpm", StringType)
  .add("speed", StringType)

val messagesParsed = data
  .select((from_json(col("Body"), jsonSchema)).alias("tmp"))
  .select("tmp.*")
  .withColumnRenamed("TimeStamp", "DeviceTimeStamp")
  .selectExpr(
    "DeviceID",
    "timestamp(from_unixtime((unix_timestamp(DeviceTimeStamp, 'M/dd/yyyy hh:mm:ss')), 'yyyy-MM-dd HH:mm:ss')) as DeviceTimeStamp",
    "cast(gps_speed as int) gps_speed",
    "cast(battery as int) battery",
    "cast(rpm as int) rpm",
    "cast(speed as int) speed"
  )

messagesParsed.createOrReplaceTempView("messagesParsed")
Note: Spark has lazy evaluation — no data has actually been read yet. This just shows the schema.
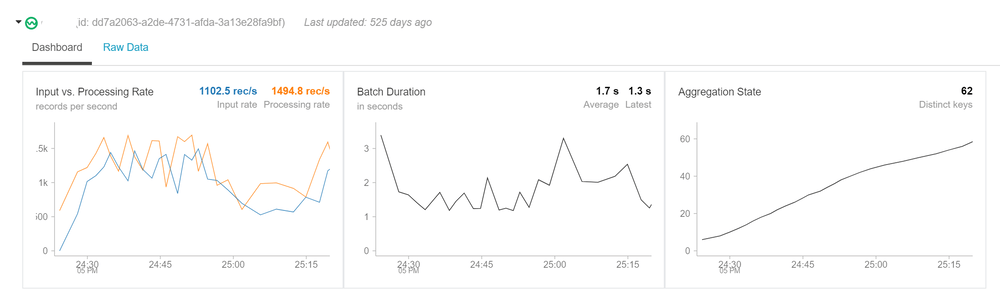
Querying the Stream
Once you query the dataset, you’ll see it is a streaming dataframe:
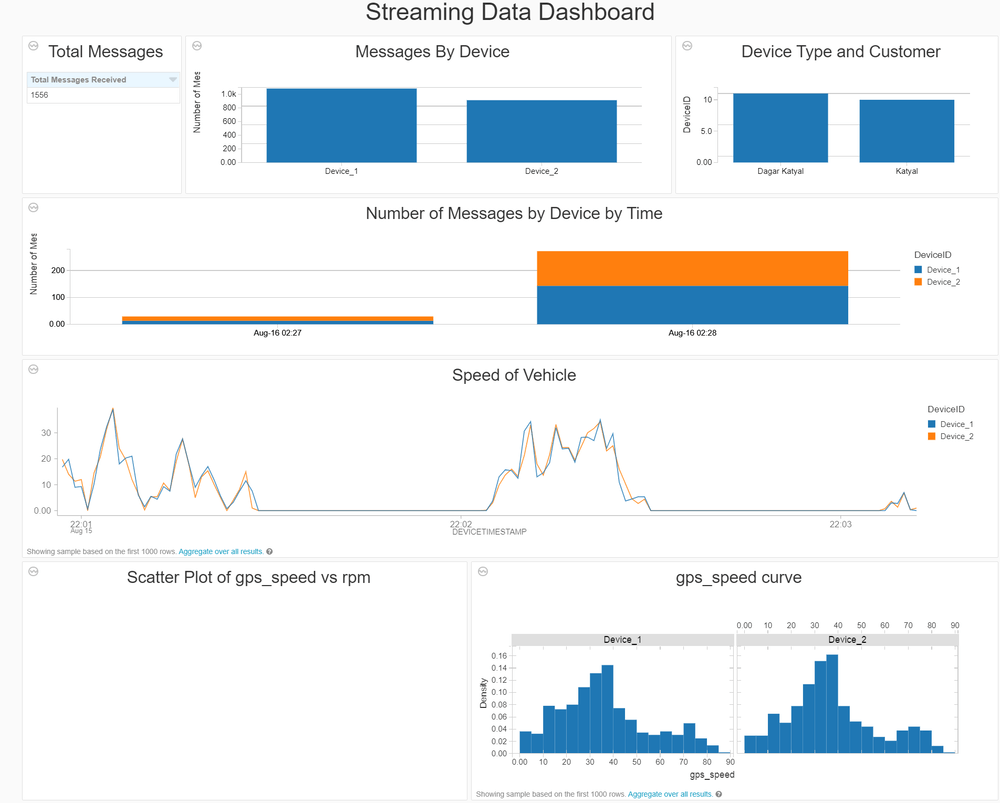
-- Total Messages Received
SELECT count(1) as 'Total Messages Received' FROM messagesParsed
Windowed aggregation by device:
val countsDF =
  messagesParsed
    .groupBy($"DeviceID", window($"DeviceTimeStamp", "1 minutes"))
    .count()

countsDF.createOrReplaceTempView("countsDF")
SELECT DeviceID,
       date_format(window.end, "MMM-dd HH:mm") as TimeWindow,
       count as 'Number of Messages'
FROM countsDF
ORDER BY TimeWindow, DeviceID
Real-Time Dashboard
Structured streaming can be used to create a real-time dashboard in Databricks and presented to users. The window functions allow grouping data and visualizing it in real time.
This was an end-to-end walkthrough of structured streaming using Databricks. Please reach out if you have any questions.